3. Graphical User Interface
As an alternative to the command line usage, Survey2GIS can also be used via its built-in graphical user interface (GUI). There are two ways of starting the software in GUI mode:
- Run “survey2gis” without any options: the GUI will start with default option settings.
- Run “survey2gis” with the special option “–show-gui”: the GUI will reflect any option settings given on the command line.
The GUI is divided vertically into two main areas (see below). On the left side of the GUI, you will find all options that are also available via the command line. There are four pages: The page “Basic” has all options for basic data processing; the page “Extra” affords access to additional functionality such as data selections (see 6) and labels (see 5); the page “Reprojection” allows to specify reprojection options (see 8); the page “Advanced” has options for fine-tuning the processing.
The screenshot below shows the GUI layout (GNU/Linux operating systems; graphical appearance will vary on different systems):
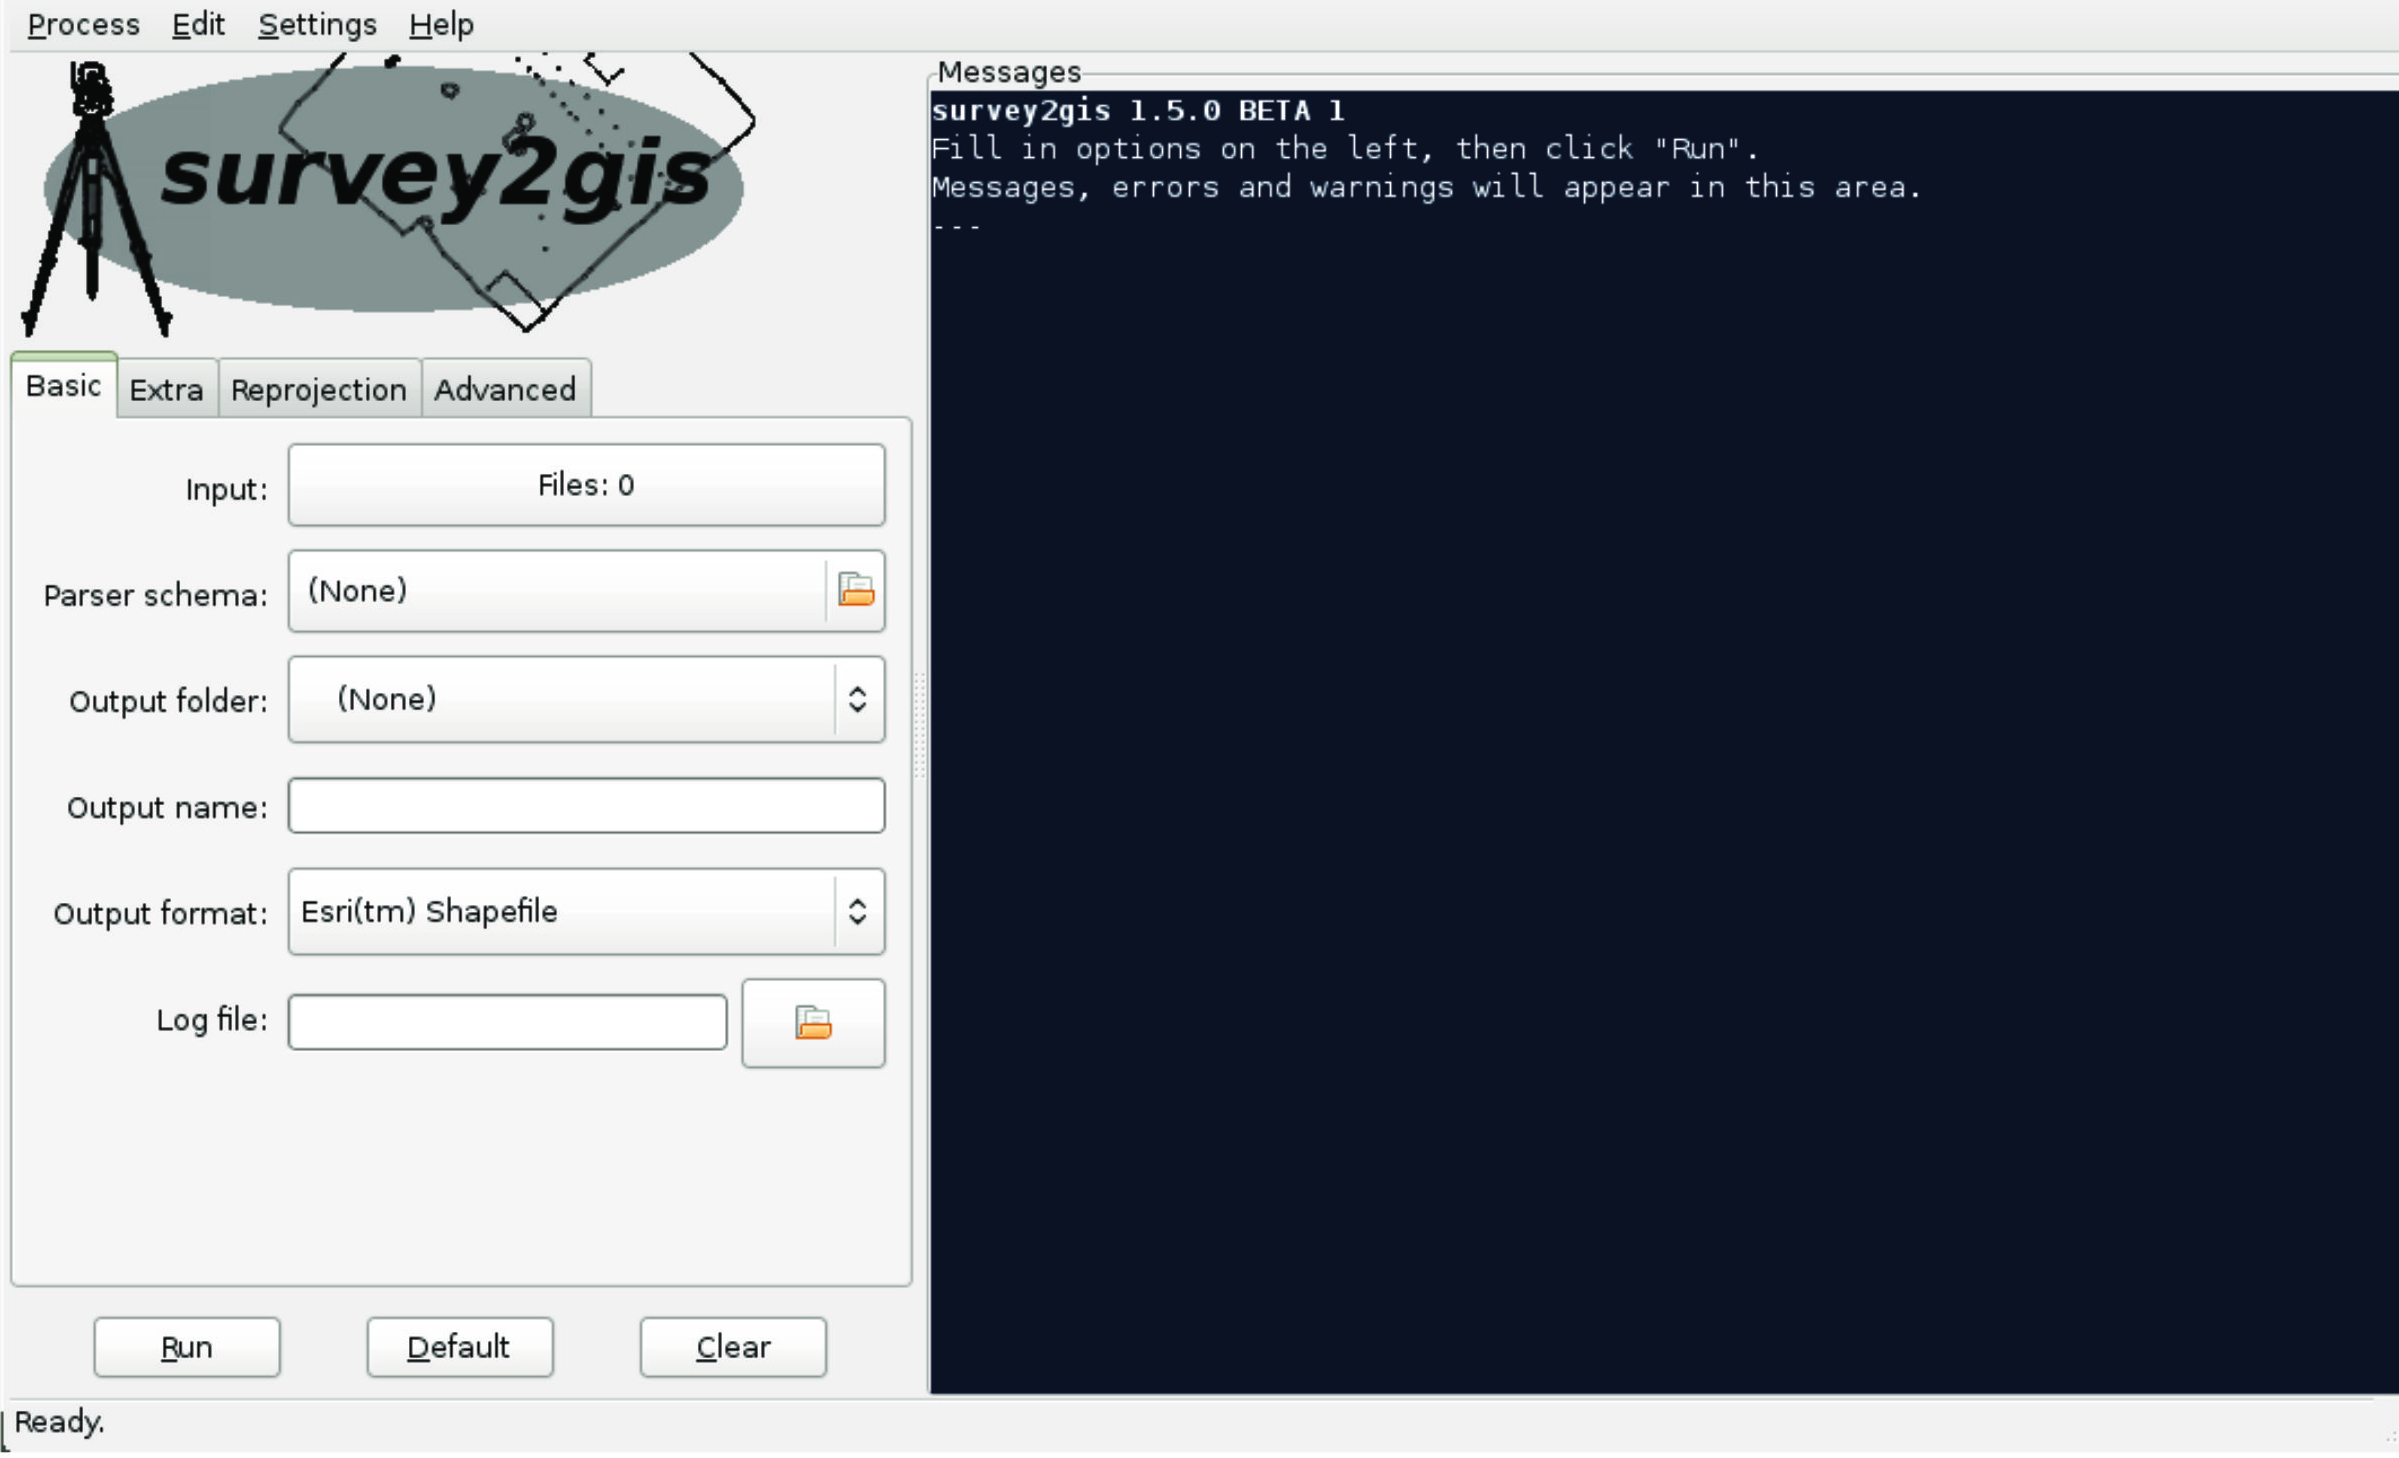
Once at least all required settings have been made on the “Basic” page, pressing the button “Run” will start the data processing. Any messages generated by Survey2GIS during data processing will be displayed in the message area on the right side of the GUI. Its content mirrors that of both the command line output and the (optional) log file.
Warnings are displayed in yellow. They do not lead to an interruption of data processing, but may contain important hints regarding input data problems.
Error messages are displayed in red and lead to termination of data processing, in which case not output data will be produced.
In order to avoid having to re-enter frequently used option values, the current settings can be saved into a file with extension “.s2g” using the “Settings ▷ Save/As” command from the main menu.
Only those option settings will be saved that have actually been specified, making it possible to save and restore partial sets of settings.
The menu item “Settings ▷ Defaults” (or the button with the same name at the bottom of the GUI) is used to restore settings from a file called “default.s2g” stored in the same folder aus Survey2GIS (provided such a file exists).
Warning: Any file present in the output folder will be overwritten without warning if a new file of the same name is produced. This is true for both output data and log files. Likewise, if a settings file is loaded then the current settings in the GUI will be replaced without warning.
3.1 Integrating the GUI into Another Application
The integration of the Survey2GIS GUI into a host application (e. g. a GIS) is assisted by Survey2GIS in two ways:
- The host application can pass some settings to to Survey2GIS and then add the “–show-gui” option to show the GUI.
- While Survey2GIS is running in GUI mode, it will output all its messages to the standard output stream with special markups. The host application can watch the output stream and react to the markup tags (see below).
If Survey2GIS has produced data, then the following tags will be present in the output stream:
<OUTPUT FORMAT>format </OUTPUT FORMAT>
…with “format” being the name of the output format produced, such as “Esri Shapefile”.
This is followed by the names of the actual output files, separated by geometry type:
<OUTPUT POINTS>data </OUTPUT POINTS>
<OUTPUT LINES>data </OUTPUT LINES>
<OUTPUT POLYGONS>data </OUTPUT POLYGONS>
…with data being the file name of the respective dataset.
If the user has set the “–raw-data” option, then there will be an additional:
<OUTPUT POINTS RAW>data </OUTPUT POINTS RAW>
Since it is possible that the user has produced several different output formats and files during one session with Survey2GIS, the host application will always have to analyse the entire output stream.